

Modernized with AI/IT Terminology: A Unified Predictive Analytics Architecture
Tatacoa AI system architecture is engineered to deliver state-of-the-art predictive analytics by leveraging a composable stack of advanced machine learning and deep learning frameworks.
The core of this solution is a 'Unified Data Processing Architecture' designed to execute advanced analytical methodologies. It seamlessly interfaces with both historical data repositories (e.g., data warehouses, data lakes) and real-time streaming data sources (e.g., Kafka event buses, IoT platforms). This dual-mode, or hybrid, capability enables the comprehensive application of sophisticated predictive techniques.
Core System Capabilities:
- Longitudinal & Time-Series Analysis: The system ingests and analyzes historical database records—such as transactional data, event logs, and past sensor readings—to model complex time-series patterns. This process establishes operational baselines and enables robust, long-term trend forecasting.
- Real-Time Multimodal Anomaly Detection: This framework deploys online learning and stream processing models to analyze high-velocity, multimodal data feeds in real-time, including sensor data, voice, environmental audio, video, and imagery. This capability allows for the immediate identification of critical deviations from established baselines and the detection of complex events as they unfold.
- Contextual Data Fusion & Enrichment: The solution enhances real-time analytics by correlating high-velocity streaming inputs with deep contextual data extracted from historical databases. This process goes beyond simple data point analysis, providing crucial 'context-aware' awareness to enable more accurate, nuanced, and explainable predictions.
- Actionable & Interpretable Insights: This methodology is designed to transform heterogeneous data streams from heterogeneous enterprise systems into 'actionable and intelligible' predictions. It addresses the significant technical integration and data orchestration challenges required to unify past (batch) and current (streaming) data, ensuring that the resulting insights are not only powerful but also 'interpretable'.


The following Tatacoa AI architectures are being rigorously benchmarked for their predictive accuracy, domain adaptability, and operational scalability within a hybrid data context. This environment is engineered for unified processing of both data-at-rest (historical databases) and data-in-motion (live data streams):
A. Deep Neural Networks (DNNs):
- Analyzes (Historical Data-at-Rest): Delivers state-of-the-art representation learning by autonomously discovering complex, non-linear relationships and latent features within vast historical datasets (e.g., transactional records, event logs, and time-series sensor archives).
- Requires (Training Phase): Mandates significant compute resources (GPU/TPU clusters) and is highly data-hungry, requiring extensive, high-quality labeled historical datasets. This makes robust data engineering and MLOps pipelines essential for effective model training and to realize its full predictive potential.
- Applies (Streaming Data-in-Motion): Once trained, the model artifact is best deployed for real-time inference within a data-rich, scalable infrastructure (e.g., Kubernetes or serverless functions). This enables large-scale, high-accuracy forecasting by applying its historically-trained model to current, live data inputs.
B. Large Language Models (LLMs):
- Analyzes (Hybrid Data Context): Achieves advanced predictive and generative capabilities by synthesizing real-time, unstructured data streams (e.g., text, voice, logs) with historical structured and unstructured knowledge bases. This fusion enables deep, context-aware reasoning.
- Excels: Demonstrates state-of-the-art performance in NLU/NLG (Natural Language Understanding/Generation) tasks. This includes generative analytics (e.g., dynamically summarizing current system status based on past events), semantic search, and domain-specific reasoning, all derived from its foundation model architecture.
- Applies (Hybrid Architecture): Offers massive scalability and flexibility. It is commonly adapted via Retrieval-Augmented Generation (RAG), a technique that dynamically injects real-time, proprietary information from vector databases or data warehouses into the model's context. This "grounds" the model's responses in factual, current data with moderate MLOps and deployment complexity.
C. Deep Reinforcement Learning (DRL):
- Analyzes (Real-Time Data-in-Motion): Achieves superior precision in dynamic optimization and autonomous decision-making tasks (e.g., control systems, supply chain logistics). The DRL agent continuously optimizes its policy (decision-making strategy) by learning from a live data stream of environmental states and reward feedback.
- Combines (Hybrid Data Context): Implements an autonomous agent where the policy or value function is approximated by a Deep Neural Network (DNN). This DNN acts as a powerful feature extractor, often pre-trained on historical data. Furthermore, historical databases can be leveraged for "Offline RL" to pre-train the policy from a static dataset, dramatically enhancing sample efficiency before live, online deployment.
- Applies (Sequential Decision-Making): Ideal for complex sequential decision-making problems where current actions, based on real-time data inputs, directly influence future states and cumulative rewards. It supports high-accuracy analytics by processing high-dimensional, multimodal state representations (e.g., fusing video, sensor, and log data).
This advanced, modular architecture enables Tatacoa AI to deliver measurable business outcomes through accurate and scalable predictive analytics. It is tailored for complex, rapidly evolving operational contexts that depend on actionable insights from both historical (data-at-rest) and real-time (data-in-motion) data.


Tatacoa is a technology venture founded by partners Bernardo Rincón Cerón and Juan Manuel Carretero Toro.
The company's core assets are its deep expertise in data science, systems architecture, and applied AI/ML, integrated with proven capabilities in go-to-market (GTM) strategy and Agile project delivery. Tatacoa is focused on engineering efficient, high-impact, data-driven solutions and excels at assembling bespoke, cost-efficient technical teams tailored to specific client engagements.
Company Location: Bogotá, Colombia.
Founders
Success Cases
Georgia Tech, USA
Scope: Analysis of survey data from victims of human trafficking.
Activities:
Constructed a database of the survey data.
Sourced and integrated economic data on inequality from a Harvard University database and income from Kaggle.com.
Performed data preprocessing.
Built a Markov state transition matrix and graphs.
Conducted time-focused and socioeconomic analysis.
Outcome:
A global map of human trafficking origins and destinations, including the number of people involved (based on the survey population).
Analysis of the total number of cases per year using exponential smoothing to detect significant changes over time.
A table classifying the activities victims are involved in (e.g., "Agriculture," "Domestic work," "Prostitution") by categories such as "Work force," "Sex related," and "Slavery / exploitation".
Degree of relations between nations involved

Degree of relations between nations involved

Success Cases
SOP S.A.S. (Blueberry crop)
Scope: Construction of AI models to predict monthly and annual blueberry harvest volumes.
Activities:
Built a database using crop information and weather data collected every 5 minutes from an in-house station.
Conducted data cleaning, statistical analysis, data engineering (handling outliers, normalization), and correlation calculations.
Built eight different models and selected two (one monthly, one annual) for production.
Calculated the importance of each variable.
Used the central limit theorem to improve prediction performance.
Result:
The monthly model for 2024 achieved 96% annual cumulative accuracy. The median achieved the highest result at 96%.
The annual model for 2024 achieved a 94% annual accuracy for cumulative data.
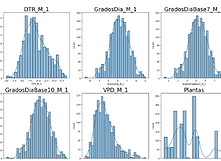
Randomly selected examples of the presentation of values and envelope curves for model variables
Correlation indicators between all numerical variables in the model

SOP S.A.S. (Blueberry crop)
Purpose: Present an efficient, AI-based solution for predicting crop production, enabling agricultural clients to make data-driven decisions and enhance reliability in forecasting.
Crop Types Addressed: Covers both temporary (removed after harvest) and permanent crops (remain after harvest).
Variables Considered: Includes irrigation, phenology/crop cycle (sowing, flowering, harvesting), climate, soil quality, and production metrics.
Analytical Approach:
- Uses at least 2 years of historical data.
- Involves recognizing data status, cleaning bad data, descriptive analytics, variable selection, and correlation analysis to minimize model bias.
- Highlights the importance of each variable in crop productivity.
Predictive Methodologies: Employs AI models such as random forests, deep learning (deep neural networks), and support vector machines for processing complex, multi-variable agricultural data.
Case Study: Blueberry farming in Zipaquirá, Colombia, with 20 lots featuring different varieties; the goal was to forecast production across various time periods using multiple environmental and operational variables (climate, lot details, time).
Results and Benefits: Implementation led to improved resource optimization, better decision-making, and increased predictability for tropical farmers.
Conclusion: Invites stakeholders to adopt the AI-powered methodology to enhance agricultural productivity and optimize operations.

Success Cases
University of Texas at Austin (Seedling Classification)
Scope: To build a model that classifies seedling species based on an image.
Activities:
Performed data analysis using statistical methods.
Analyzed 12 different seedling species.
Built four models using different neural network techniques.
Selected the model with the best response, which utilized transfer learning
Example with a random selection of seedling images from the 12 species analyzed

Success Cases
University of Texas Hackathon Competition
Result: Placed second in 2022 and fourth in 2023.
Context: The project involved analyzing a dataset related to restaurants, with variables such as "Annual Turnover," "Cuisine," "Restaurant Zomato Rating," and "Overall Restaurant Rating"
Saving the outputs in a data frame and then exporting it to a “.csv” file with the appropriate “Registration Number”.

Success Cases
University of Texas at Austin (Bank Customer Retention)
Scope: To predict the retention of a bank customer (whether they "Exited") over a 6-month period.
Activities:
Analyzed customer data variables, including "CreditScore," "Age," "Tenure," "Balance," "NumOfProducts," and "IsActiveMember”.
Performed data cleaning and normalization.
Conducted univariate, correlation, and multivariate analysis.
Built and analyzed four AI models using neural networks.
Result: The best model was selected. A confusion matrix of this model (without fine-tuning) shows it achieved an Accuracy of 0.843.
Predict the retention of a bank customer within a 6-month period from a given point in time, based on the following list of variables
